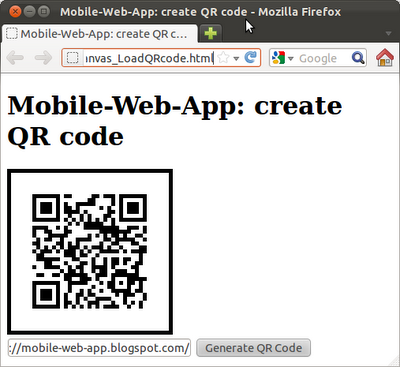
Google Chart Tools: Infographics provide API to generate QR Code easily.
It's a example to create QR Code using Google Chart Tools, and display on canvas.

<!DOCTYPE html>
<html>
<head>
<meta charset="UTF-8">
<title>Mobile-Web-App: create QR code</title>
<script type="text/javascript">

var canvas;
var context;

function loadcanvas(){

 canvas = document.getElementById("mycanvas");
 context = canvas.getContext("2d");

}

function enter() {

 var QRprefix = "https://chart.googleapis.com/chart?chs=200x200&cht=qr&chl=";
 var userenter = document.getElementById("textin").value;

 var QRimage = new Image;
 QRimage.src = QRprefix + userenter;

 QRimage.addEventListener("load",
    function(){
     context.drawImage(QRimage, 0, 0);
    } ,
    false);

}

</script>
</head>
<body onload="loadcanvas();">
<h1>Mobile-Web-App: create QR code</h1>

<canvas id="mycanvas" style="border: 5px solid;" width="200" height="200">
Sorry! Your browser doesn't support Canvas.
</canvas>
<form>
<input id="textin" type="text" />
<input type="button" value="Generate QR Code" onClick="enter()" />
</form>
</body>
</html>
No comments:
Post a Comment